
Back to Using Website Builder
Store Analytics
The store analytics page displays information on store activity including:
Store revenue
Orders received
Products sold
Discount codes used
Results panel
Date range selection
Data can be displayed for:
Last 30 days
Last 3 months
Last 6 months
Last 12 months
Custom date range
Revenue and orders graphs
For a selected date range, this graph shows the amount of revenue or number of orders over time.
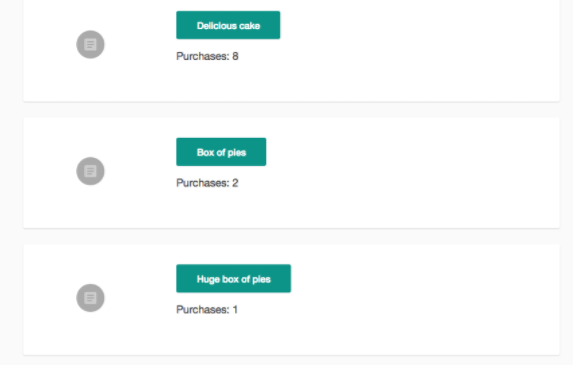
Products sold
For a selected date range, this will show a list of the products sold and the number of times each one was bought.